As a skilled Data Analyst capturing actionable insights, my projects record market strategies, data extraction, data cleaning, and data synthesis.
Explore my portfolio to witness my passion for data and its tools!
Scroll to Explore
↓
Exploring New York City’s Airbnb Market Trend
Tools and Technologies Used:
Jupyter Notebook
Python
Pandas
Statistical Calculations
Descriptive Statistics
Project Objective:
"One of the most-visited cities in the world. There are many Airbnb listings in New York City to meet the high demand for temporary lodging for travelers, which can be anywhere between a few nights to many months."
I recently completed an exciting data analysis project where I took a closer look at the Airbnb listing data for the various boroughs in New York City, providing valuable insights into the short-term rental market, focusing on the average listing price.
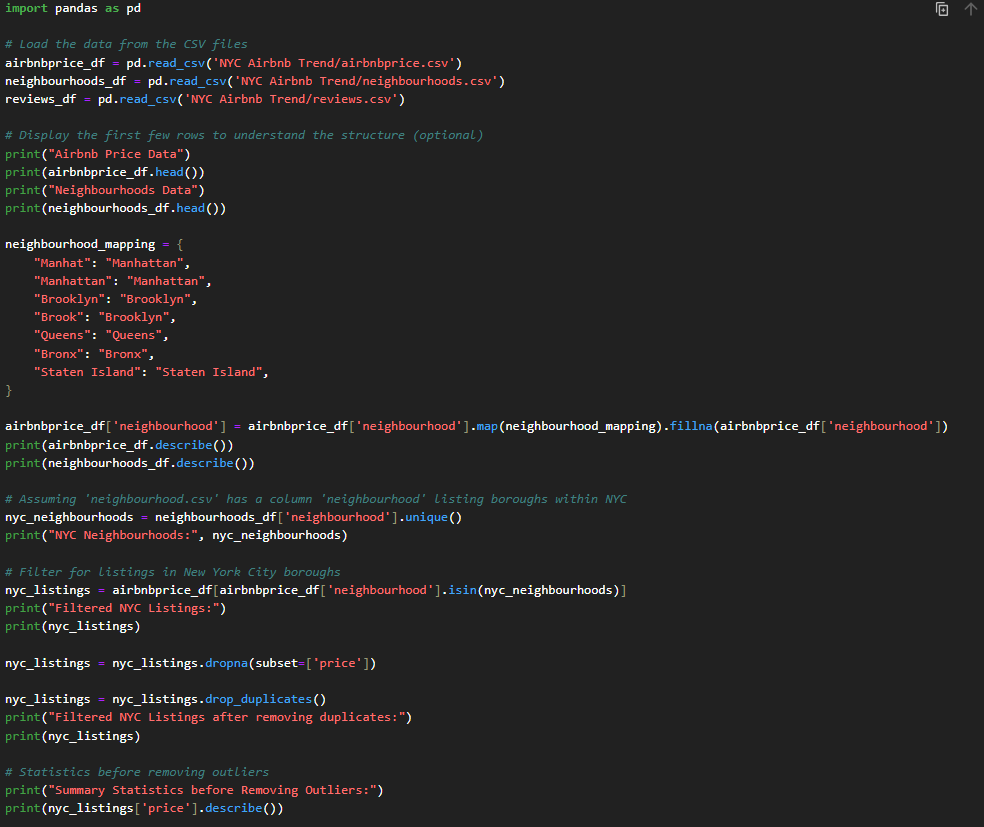
🚀 Data Extraction and Cleaning: Collected and processed data from CSV files to ensure a comprehensive data set.
📖 Review Data Analysis: Analyzed Airbnb prices and neighborhood prices, to understand the market growth over time.
📈 Market Insights: Determined the total number of listings and calculated the average listing price, providing crucial market metrics.
📊 Data Synthesis: Combined all findings into a detailed data frame, documenting key insights such as Airbnb price data, neighborhood data, summary statistics before and after removing outliers, and the average price.
Results:
After thorough cleaning and analysis, the average Airbnb listing price in New York City is $159 as of February 2024. This insight can help potential hosts and investors understand the market better and make informed decisions.
New Jersey. June, 2024
Analyzing Flight Delays and Cancellations: A 2022 Data-Driven Study on Routes, Airlines, and Weather Impacts
Project Objective:
The object of the project is to analyze flight data and weather conditions from 2022 to uncover insights into factor affecting flight delays and cancellations. Specifically, the project aims to:
Identify and Analyze Delays and Cancellations by Route
Evaluate Airline Performance
Investigate the Impact of Weather on Flight Delays
Provide Data-Driven Insights
Tools and Technologies Used:
Jupyter Notebook
Python
Pandas
Statistical Calculations
Bar Graphs
Tackled Several Key Questions:
Flight Route Analysis
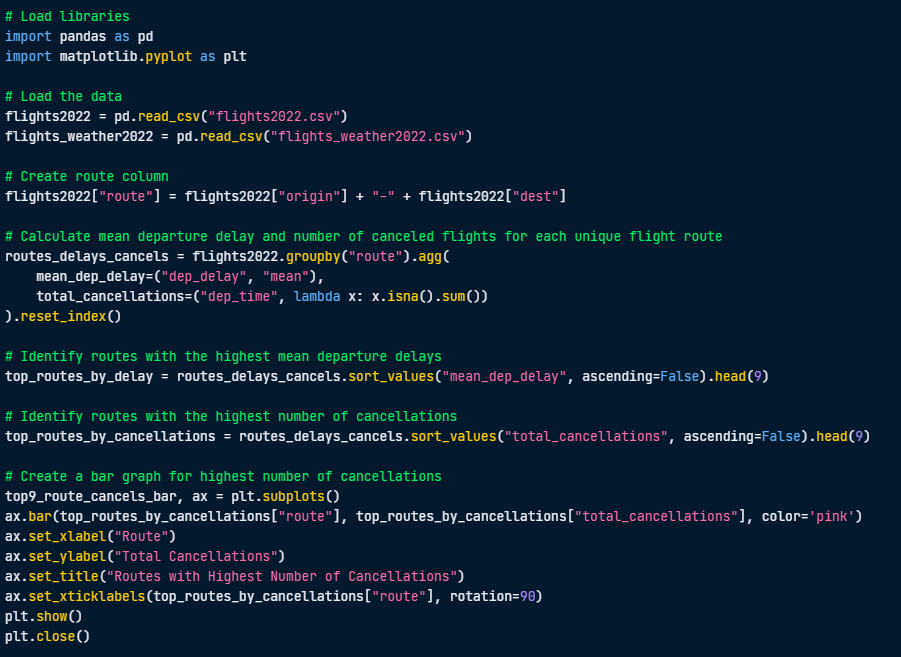
Calculated the average departure delays and the highest number of cancellations for various flight routes.
Identified the top 9 routes with the highest delays and cancellations.
Created visualizations to highlight these critical routes.
Airline Performance
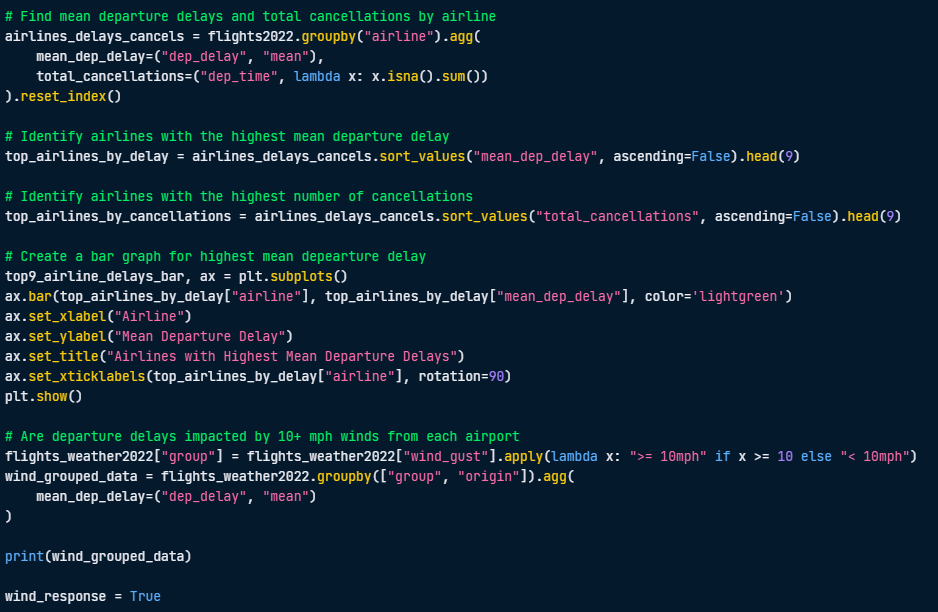
Analyzed the performance of airlines in terms of average departure delays and cancellations.
Determined the top 9 airlines with the highest delays.
Visualized these findings to easily spot patterns.
Weather Impact
Investigated the impact of wind gusts on departure delays.
Analyzed if wind gusts of 10 mph or more resulted in higher delays for flights from SEA and PDX.
CALORIES APPLICATION
Project Objective:
This application is specifically designed for patients who have chronic diseases, aiming to help them better track their calorie consumption. With the ability to capture images of food items, the app seamlessly calculates the number of calories, providing users with valuable insights into their dietary intake.
The tools and technologies that were used to create this application are Android Studio, Java, and Adobe XD (for prototype design).
Sign-Up:
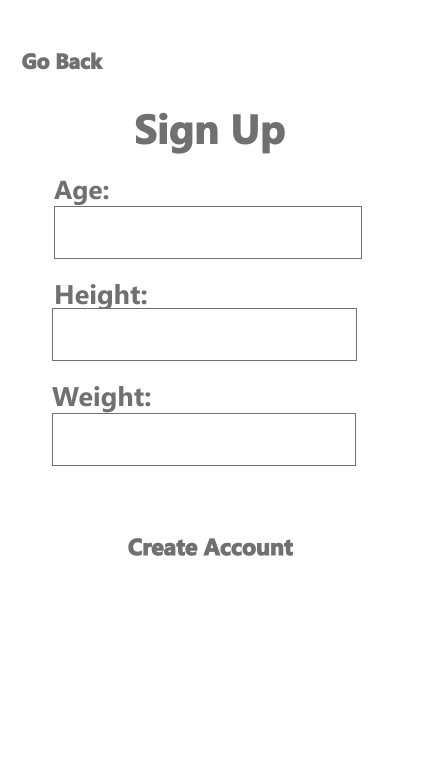
For this application, entering information such as age, weight, and height is crucial as it helps the application better understand ones body and eating habit.
Entering this information will be the last step of the Sign-Up process and the user is ready to utilize their new application.
Tutorial:
Like every new application, sometimes it can be difficult navigating through the application. Since our audience may be older, we installed a tutorial of how to utilize the application. Once they are done, they can go ahead and click the arrow on the bottom right.
Main Page:
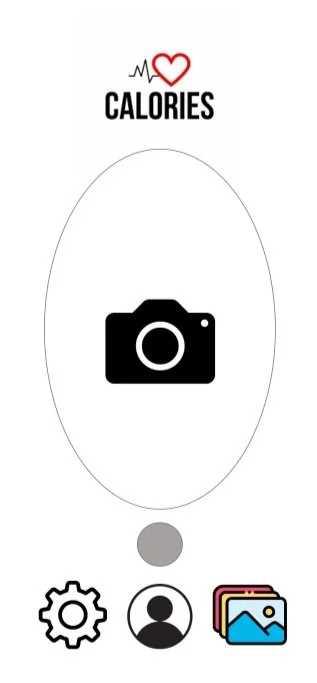
After successfully creating the account or signing in, the user can apply their food intake by capturing an image of their food and the application calculating the number of calories that food item contains.
Sign-Up:
From the Sign-In page, if the user does not have an account, they are welcome to create on by clicking the Sign-Up button on the top right corner. The Sign-Up page consists of the user entering their email address and password so they can create their account to access the application.
The Sign-Up page then allows the user to either select Next or “Already a user? LOGIN” button.
Reset Password:
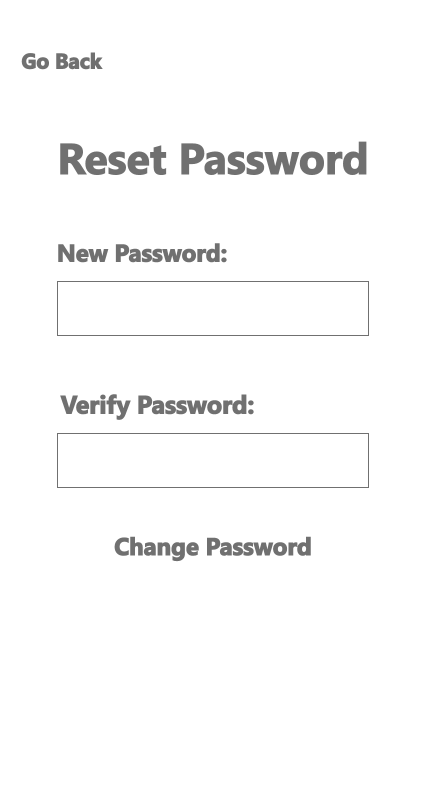
The Reset Password page allows the user to create a new password if by any means they forgot their previous one.
After they choose their new password and verify it, they can go ahead and click the Change Password button.
Sign-Up or Sign-In:
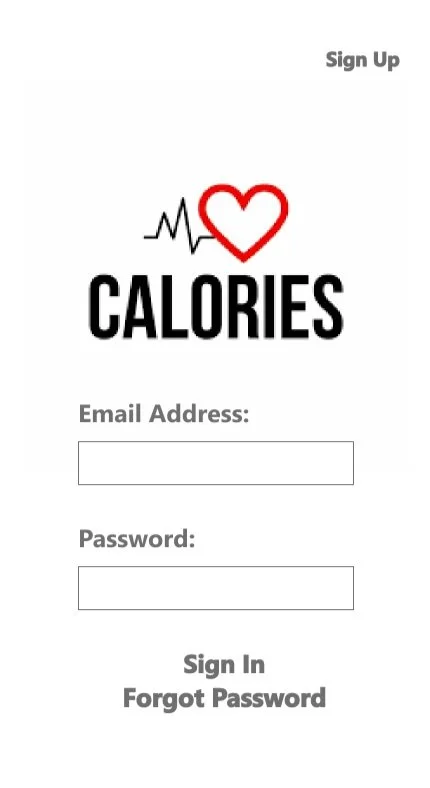
The Sign-In page consists of the user entering their email address and password so they can access their account in the application.
The Sign-In page consists of three feature buttons: Sign-Up, Sign-In and Forgot Password.

